2024-03-13 These days we have an excellent ecosystem with Grafana Loki, Promtail, Tempo, and friends
Up until now I have used basic log files of strings for applications that I have developed. But as the applications have become larger and been used by more people, dealing with huge verbose log files becomes a real time-waster.
In a blog post on structured logging, Gregory Szorc wrote about five major use cases of logging:
- Recording application errors (e.g. exceptions and stack traces).
- Low-level information to aid in debugging or human observation.
- Application monitoring (includes metrics and alerting).
- Business analytics (use the logged data to help make decisions).
- Security auditing.
For concreteness, consider a program that I developed for processes imaging datasets for cloud storage. It handles a pipeline for retrieving imaging datasets from MRI scanners, conversion to a format suitable for archival and further processing, and access control for staff in projects.
The five use cases correspond to these kinds of questions:
- Which users are encountering errors? (Some users quietly give up and don’t tell you about errors!) Does a new imaging instrument provide data that is not supported? Produce a report listing users by number of errors, or by instrument, or by …
- User X walks up to you and asks why they can’t see their dataset titled “something something something”. Find where their dataset is in the pipeline, and give a concrete estimate for when they will be able to see their data.
- How long does each dataset take to process? Where are the bottlenecks?
- How many datasets does department X process per week? What about department Y? Or user Z?
- When did user X get access to dataset Y?
Answering these questions is possible with logs containing plain strings, but it becomes difficult to run more complicated queries since regexes don’t scale very well.
The idea with structured logging is to log JSON blobs or key/value pairs instead of plain strings, so a structured log might look like this:
2016-04-24-1722 [patient_id=12345] [action=started_processing]

2016-04-24-1723 [patient_id=12345] [action=identified] [user=uqbobsmith] [dataset_id=10000]
                                   [project_id=999] [nr_files=20000] [patient_name="john something doe"]

2016-04-24-1724 [patient_id=12345] [action=processing_subset] [user=uqbobsmith] [dataset_id=10000]
                                   [project_id=999] [subset_id=3434]

2016-04-24-1734 [patient_id=12345] [action=uploaded_subset] [user=uqbobsmith] [dataset_id=10000] [project_id=999]
                                   [subset_id=3434] [remote_id=77a70620-3f22-47b5-8da2-ba2c2100f001] [time=600]

2016-04-24-1730 [patient_id=12345] [action=error] [user=uqbobsmith] [dataset_id=10000] [project_id=999]
                                   [subset_id=3435] [error_string="Did not find header file"]

2016-04-24-1742 [patient_id=12345] [action=finished] [user=uqbobsmith] [dataset_id=10000] [project_id=999] [time=1200]

2016-04-24-1750 [patient_id=12345] [action=acl] [acl_action=add] [user=uqbobsmith] [dataset_id=10000] [project_id=999]
Now the five questions can be framed in terms of queries over the structured data:
- Find all entries with
action=errorand report on the fielduser=.... - Find the most recent log entries with
user=uqbobsmith; filter bypatient_namefield; filter errors; or viewtimefield to see how long each subset is taking to process. - Plot the time-series of
time=...values. - Filter on
user=...andaction=finished; join with a table linking user IDs to departments; group by department names. - Filter on
acl_action=addanduser=uqbobsmith; sort by timestamp.
As a proof of concept I knocked up django-struct-log. Since Postgresql has support for key-value pairs (including queries and indexes!) it is the logical choice for the storage of log items. The django-hstore package extends Django’s ORM model to handle Postgresql key/value pairs. And django-rest-framework provides a REST API for programs to post log entries.
The Django model for log items is in models.py:
class LogItem(models.Model):
    created_at = models.DateTimeField(auto_now_add=True)
    updated_at = models.DateTimeField(auto_now=True)

    # e.g. 'rdiff-backup'
    name = models.CharField(max_length=200)

    # e.g. 'my-server-1'
    host = models.CharField(max_length=200)

    # e.g. 'carlo'
    user = models.CharField(max_length=200)

    # Maybe something nice for a graph or email subject line.
    # e.g. 'daily rdiff-backup of something'
    description = models.TextField()

    # key/value blob
    attributes = HStoreField()
We don’t have to define any views, just a serializer and view-set for the model. This is in urls.py:
class LogItemSerializer(serializers.HyperlinkedModelSerializer):
    class Meta:
        model = LogItem
        fields = ('name', 'host', 'user', 'description', 'attributes', 'created_at', 'updated_at',)

class LogItemViewSet(viewsets.ModelViewSet):
    authentication_classes = (SessionAuthentication, BasicAuthentication, TokenAuthentication)
    permission_classes = (IsAuthenticated,)

    queryset = LogItem.objects.all()
    serializer_class = LogItemSerializer

router = routers.DefaultRouter()
router.register(r'logitems', LogItemViewSet)
Surprisingly, that’s pretty much it.
Using TokenAuthentication makes authorization easy (no username/passwords stored in plain text) and with the REST API we can post a log item using curl:
curl
    -H "Content-Type: application/json"
    -H "Authorization: Token 5a610d074e24692c9084e6c845da39acc0ee0002"
    -X POST
    -d '{"name": "rdiff-backup", "host": "my-server-1", "description": "blah", "user": "carlo", "description": "daily rdiff-backup", "attributes": {"time_s": "1230"} }'
    http://localhost:8000/logitems/
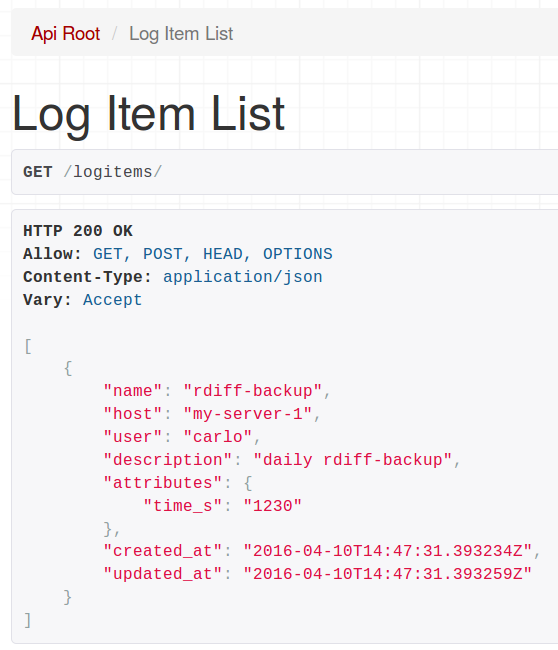
The response should be something like:
{"name":"rdiff-backup",
 "host":"my-server-1",
 "user":"carlo",
 "description":"daily rdiff-backup",
 "attributes":{"time_s":"1230"},
 "created_at":"2016-04-10T14:47:31.393234Z",
 "updated_at":"2016-04-10T14:47:31.393259Z"}
This means that almost anything can send data to the log server – shell scripts, Python scripts, Haskell programs, anything.
Pulling out data for plotting is easy using Django’s ORM model. For example to get all the log items for server1 with a time_s attribute:
data = LogItem.objects.filter(name='server1', attributes__has_key='time_s').all()
x = [z.created_at for z in data]
y = [float(z.attributes['time_s'])/60.0 for z in data] # minutes
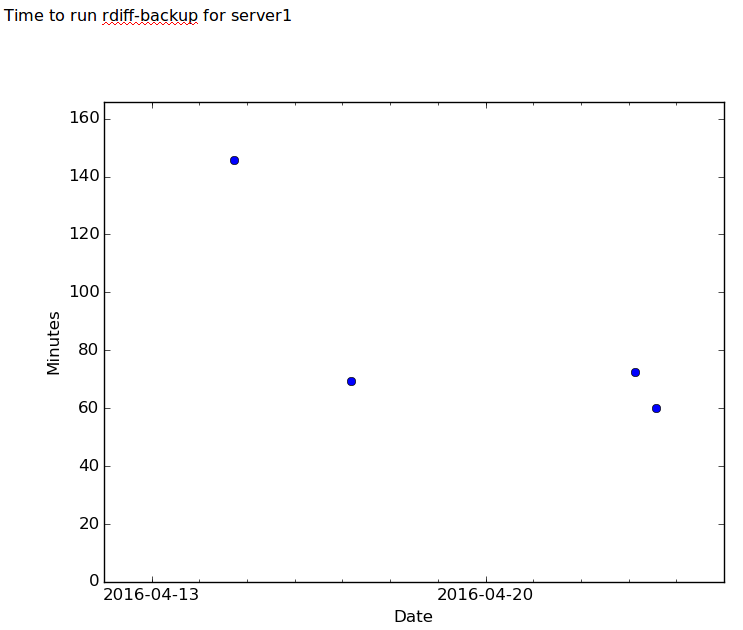
Here is a sample script for a nightly report. It uses Matplotlib to draw a graph and the email library to format a HTML email.
import django
import os
import sys

from email.mime.text import MIMEText
from subprocess import Popen, PIPE
from email.MIMEMultipart import MIMEMultipart
from email.MIMEText import MIMEText
from email.MIMEImage import MIMEImage

import matplotlib
matplotlib.use('Agg') # Force matplotlib to not use any Xwindows backend.
import matplotlib.pyplot as plt

import datetime as dt

sys.path.append("..")
os.environ.setdefault("DJANGO_SETTINGS_MODULE", "djangostructlog.settings")
import django
django.setup()

from structlog.models import LogItem
import numpy as np

def send_email(subject, body, plot_png):
    # adapted from http://code.activestate.com/recipes/473810/

    strFrom = 'carlo@example.com'
    strTo   = 'carlo@example.com'

    msgRoot = MIMEMultipart('related')
    msgRoot['Subject'] = subject
    msgRoot['From']    = strFrom
    msgRoot['To']      = strTo
    msgRoot.preamble   = 'This is a multi-part message in MIME format.'

    # Encapsulate the plain and HTML versions of the message body in an
    # 'alternative' part, so message agents can decide which they want to display.
    msgAlternative = MIMEMultipart('alternative')
    msgRoot.attach(msgAlternative)

    msgText = MIMEText('This is the alternative plain text message.')
    msgAlternative.attach(msgText)

    # We reference the image in the IMG SRC attribute by the ID we give it below
    msgText = MIMEText(body + 'n<br /> <img src="image1" />', 'html')
    msgAlternative.attach(msgText)

    # This example assumes the image is in the current directory
    fp = open(plot_png, 'rb')
    msgImage = MIMEImage(fp.read())
    fp.close()

    # Define the image's ID as referenced above
    msgImage.add_header('Content-ID', '')
    msgRoot.attach(msgImage)

    p = Popen(["/usr/sbin/sendmail", "-t", "-oi"], stdin=PIPE)
    p.communicate(msgRoot.as_string())

def make_plot(n):
    data = LogItem.objects.filter(name=n, attributes__has_key='time_s').all()
    x = [z.created_at for z in data]
    y = [float(z.attributes['time_s'])/60.0 for z in data]

    for (a, b) in zip(x, y):
        print n, a, b

    fig, ax = plt.subplots()
    plt.plot_date(x, y)
    delta = dt.timedelta(days=2)
    ax.set_xlim(min(x).date() - delta, max(x).date() + delta)
    ax.set_ylim(0, max(y) + 20)

    ax.xaxis.set_ticks(x)

    start, end = ax.get_xlim()

    from matplotlib.dates import YEARLY, WEEKLY, DateFormatter, rrulewrapper, RRuleLocator, drange
    rule = rrulewrapper(WEEKLY)
    loc = RRuleLocator(rule)

    formatter = DateFormatter('%Y-%m-%d')
    ax.xaxis.set_major_locator(loc)
    ax.xaxis.set_major_formatter(formatter)

    from matplotlib.ticker import MultipleLocator, FormatStrFormatter
    from matplotlib.dates import DayLocator
    minorLocator = DayLocator()
    ax.xaxis.set_minor_locator(minorLocator)

    plt.xlabel('Date')
    plt.ylabel('Minutes')

    plt.savefig('foo.png') # FIXME use temp file instead!
    return 'foo.png'


#########################################################################

rdiff_server1_png = make_plot('rdiffbackup-server1')
send_email('rdiff-backup report - server1', '<p> Time to run rdiff-backup for server1 </p>', rdiff_server1_png)

rdiff_server2_png = make_plot('rdiffbackup-server2')
send_email('rdiff-backup report - server2', '<p> Time to run rdiff-backup for server2 </p>', rdiff_server2_png)

print 'done'
Sample plot:

For exploring the log items you can poke around in the Django admin interface, or use the django-rest-framework’s endpoint:

Pointy edges Link to heading
- Can you write queries on numeric fields that are stored as strings? http://stackoverflow.com/questions/36782029/django-numeric-comparison-of-hstore-or-json-data
- If the server is down, the http post will fail or timeout, and the log item will be lost forever. A smarter client could keep log items in a local persistent queue and try to send them later.
Links Link to heading
- django-struct-log proof of concept.
- django-hstore API
- katip – structured logging in Haskell. Also has a backend for Elasticsearch.
- http://gregoryszorc.com/blog/2012/12/06/thoughts-on-logging-part-1-structured-logging/
- http://matthewdaly.co.uk/blog/2015/08/01/exploring-the-hstorefield-in-django-1-dot-8/