Profiling tools like gprof tell us about where a program spends the most time but these places aren’t necessarily the best candidates for optimisation. Also, we have no idea of how much overall improvement we would see for a certain amount of optimisation. This problem gets harder for multithreaded or distributed systems.
Here’s a system for image classification (taken from this great talk).
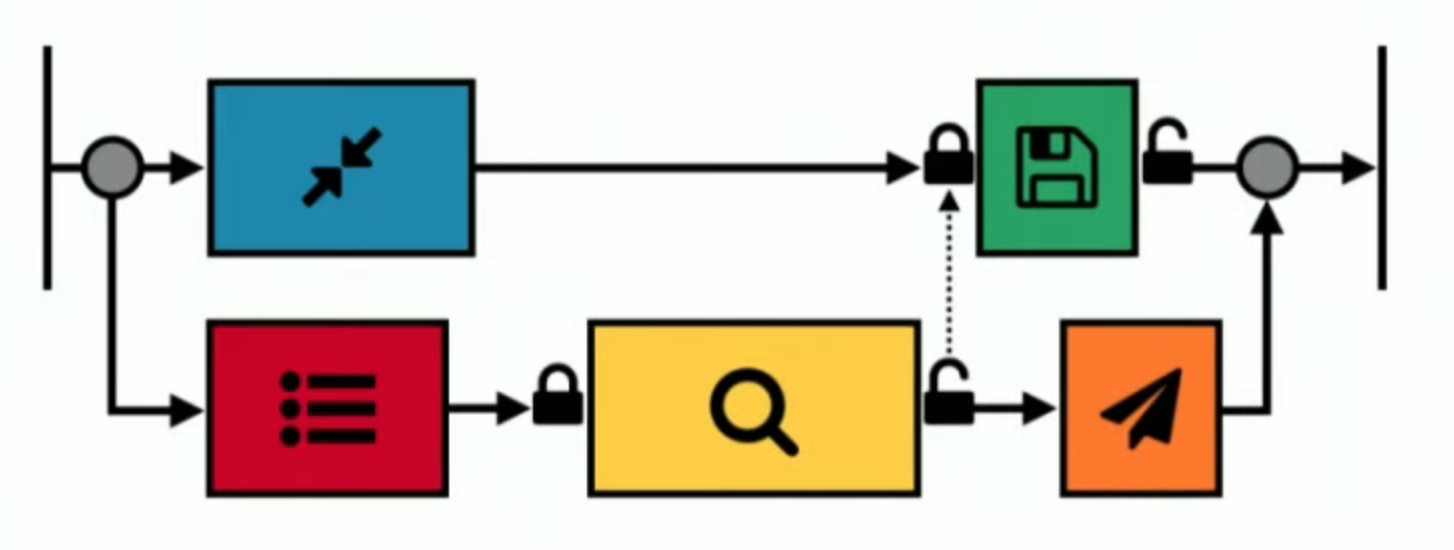
An input image flows through two parallel sets of tasks. Along the top line, the image is compressed and then saved. Along the bottom line features are extracted, then a search is done on a database, and then a result is sent. The search and save operations lock a global resource so they can’t execute in parallel.
We want to improve the overall processing time, but how do we know where to focus our effort? Normal profilers tell us which lines of code run for the longest time, but this doesn’t tell us how the overall time would change if a component is sped up by some amount.
Causal profiling lets us answer this question by running experiments on the real system by using virtual speedups. Here is the key observation: say we have a simple program that runs tasks \( a \) and \( b \). The overall run time is \( a + b \). If we knew a way to optimise \( b \) so that it runs in time \( f b \) where \( 0 < f < 1 \) then the overall speedup would be
\[ S = \frac{a + b}{a + f b} \]Since $f$ is non-zero, we can divide everything by $f$:
\[ S = \frac{a + b}{a + f b} = \frac{ {a}/{f} + {b}/{f} }{ {a}/{f} + b} \]and we discover that the speedup due to a faster $b$ is equivalent to slowing down everything by $1/f$ and running $b$ with no slowdown.
So to simulate a speedup, we just have to slow down each component by a factor (we can do this with a sleep at the end of the task), and then run the program again but remove the sleep from the component of interest. So we can simulate our system with different values of $f$ to see what the overall effect would be!
Here’s a simulation of the image processing workflow. We see that speeding up the compression task is not useful until it causes a change in the order of the search and save components, at which point the overall run time becomes worse. Conversely, speeding up the save task gives a consistent speedup to the overall program. The code here verifies that the real and virtual speedups agree.
Such a simple idea, but so useful!

Further reading Link to heading
Image workflow causal profiling: github.com/carlohamalainen/playground/tree/master/python/cozsim
COZ: Finding Code that Counts with Causal Profiling - Charlie Curtsinger and Emery D. Berger