Heatmaps are an excellent way to visualise real-time system performance, as they provide a concise and intuitive representation of response time distributions across multiple dimensions. Some of these dimensions include:
- Time: a heatmap can be plotted over different time intervals to find temporal patterns in system performance.
- System components: by filtering on different subsystems, we can see the impact of database queries, caches, or API endpoints.
- Geographic locations: often this can help identify issues relating to network latency.
- User segments: users may experience different performance on mobile, laptop, desktop, or across different subscription levels like free vs premium.
- Request types: request types may correspond to different underlying operations like read vs write-heavy actions.
By using colour-coded histogram slices, heatmaps allow us to quickly identify patterns, anomalies, and trends in system behavior. Heatmaps can help guide a data-driven approach to system optimisation.
To make use of heatmaps, we have to do three things:
- Log the data.
- Set up a query for the data.
- Visualise the data.
This blog post shows how to achieve all three steps using the Grafana stack consisting of Promtail, Loki, and heatmap visualisations.
Log the data Link to heading
The simplest approach is to add manual timing information to existing log records. For example, time a critical section of code and then log the duration in milliseconds using a structured logging library like slog:
    startTime := time.Now()

    // critical section of code that we are timing

    elapsed := time.Since(startTime)

    logger.Info("step", "duration", elapsed.Milliseconds())
This produces log lines similar to:
{
  "time": "2024-04-05T10:59:25.850449+10:00",
  "level": "INFO",
  "source": {
    "function": "main.main",
    "file": "/Users/carlo/grafana/demo-logs/main.go",
    "line": 25
  },
  "msg": "step",
  "version": 1,
  "duration": 860
}
It’s good to add as much detail to this log line so that all five dimensions can be filtered (see the list at the top of this blog post).
Promtail can be configured to parse the logs and send to Loki. For local testing, here’s a simple job description that sends data to a Loki instance running on localhost:
- job_name: demo-app
  static_configs:
    - targets:
        - localhost
      labels:
        job: app
        __path__: /tmp/app.log
Query the data Link to heading
To query the data in Loki, we build a LogQL query that filters on
job="app" and selects lines with a duration:
{job="app"} |= `duration`
Using logcli, assuming we have Loki running locally:
$ LOKI_ADDR=http://localhost:3100 logcli query '{job="app"} |= `duration`'
2024/04/05 10:59:49 http://localhost:3100/loki/api/v1/query_range?direction=BACKWARD&end=1712278789325735000&limit=30&query=%7Bjob%3D%22app%22%7D+%7C%3D+%60duration%60&start=1712275189325735000
2024/04/05 10:59:49 Common labels: {filename="/tmp/app.log", job="app", service_name="app"}
2024-04-05T10:59:26+10:00 {} {"time":"2024-04-05T10:59:26.800617+10:00","level":"INFO","source":{"function":"main.main","file":"/Users/carlo/grafana/demo-logs/main.go","line":25},"msg":"step","version":1,"duration":945}
2024-04-05T10:59:26+10:00 {} {"time":"2024-04-05T10:59:26.800607+10:00","level":"INFO","source":{"function":"main.main","file":"/Users/carlo/grafana/demo-logs/main.go","line":25},"msg":"step","version":1,"duration":782}
2024-04-05T10:59:26+10:00 {} {"time":"2024-04-05T10:59:26.800597+10:00","level":"INFO","source":{"function":"main.main","file":"/Users/carlo/grafana/demo-logs/main.go","line":25},"msg":"step","version":1,"duration":11}
2024-04-05T10:59:26+10:00 {} {"time":"2024-04-05T10:59:26.800587+10:00","level":"INFO","source":{"function":"main.main","file":"/Users/carlo/grafana/demo-logs/main.go","line":25},"msg":"step","version":1,"duration":667}
2024-04-05T10:59:26+10:00 {} {"time":"2024-04-05T10:59:26.800577+10:00","level":"INFO","source":{"function":"main.main","file":"/Users/carlo/grafana/demo-logs/main.go","line":25},"msg":"step","version":1,"duration":236}
2024-04-05T10:59:26+10:00 {} {"time":"2024-04-05T10:59:26.800566+10:00","level":"INFO","source":{"function":"main.main","file":"/Users/carlo/grafana/demo-logs/main.go","line":25},"msg":"step","version":1,"duration":303}
2024-04-05T10:59:26+10:00 {} {"time":"2024-04-05T10:59:26.800554+10:00","level":"INFO","source":{"function":"main.main","file":"/Users/carlo/grafana/demo-logs/main.go","line":25},"msg":"step","version":1,"duration":175}
This confirms that the log entries are discoverable. But we need to extract
the duration label so that we can compute a heatmap. Pipe the log output to a json
stage so that it parses the json values:
$ LOKI_ADDR=http://localhost:3100 logcli query '{job="app"} |= `duration` | json'
2024/04/05 11:04:23 http://localhost:3100/loki/api/v1/query_range?direction=BACKWARD&end=1712279063986246000&limit=30&query=%7Bjob%3D%22app%22%7D+%7C%3D+%60duration%60+%7C+json&start=1712275463986246000
2024/04/05 11:04:23 Common labels: {filename="/tmp/app.log", job="app", level="INFO", msg="step", service_name="app", source_file="/Users/carlo/grafana/demo-logs/main.go", source_function="main.main", source_line="25", version="1"}
2024-04-05T10:59:26+10:00 {duration="945", time="2024-04-05T10:59:26.800617+10:00"} {"time":"2024-04-05T10:59:26.800617+10:00","level":"INFO","source":{"function":"main.main","file":"/Users/carlo/grafana/demo-logs/main.go","line":25},"msg":"step","version":1,"duration":945}
2024-04-05T10:59:26+10:00 {duration="782", time="2024-04-05T10:59:26.800607+10:00"} {"time":"2024-04-05T10:59:26.800607+10:00","level":"INFO","source":{"function":"main.main","file":"/Users/carlo/grafana/demo-logs/main.go","line":25},"msg":"step","version":1,"duration":782}
2024-04-05T10:59:26+10:00 {duration="11", time="2024-04-05T10:59:26.800597+10:00"}  {"time":"2024-04-05T10:59:26.800597+10:00","level":"INFO","source":{"function":"main.main","file":"/Users/carlo/grafana/demo-logs/main.go","line":25},"msg":"step","version":1,"duration":11}
2024-04-05T10:59:26+10:00 {duration="667", time="2024-04-05T10:59:26.800587+10:00"} {"time":"2024-04-05T10:59:26.800587+10:00","level":"INFO","source":{"function":"main.main","file":"/Users/carlo/grafana/demo-logs/main.go","line":25},"msg":"step","version":1,"duration":667}
2024-04-05T10:59:26+10:00 {duration="236", time="2024-04-05T10:59:26.800577+10:00"} {"time":"2024-04-05T10:59:26.800577+10:00","level":"INFO","source":{"function":"main.main","file":"/Users/carlo/grafana/demo-logs/main.go","line":25},"msg":"step","version":1,"duration":236}
2024-04-05T10:59:26+10:00 {duration="303", time="2024-04-05T10:59:26.800566+10:00"} {"time":"2024-04-05T10:59:26.800566+10:00","level":"INFO","source":{"function":"main.main","file":"/Users/carlo/grafana/demo-logs/main.go","line":25},"msg":"step","version":1,"duration":303}
2024-04-05T10:59:26+10:00 {duration="175", time="2024-04-05T10:59:26.800554+10:00"} {"time":"2024-04-05T10:59:26.800554+10:00","level":"INFO","source":{"function":"main.main","file":"/Users/carlo/grafana/demo-logs/main.go","line":25},"msg":"step","version":1,"duration":175}
2024-04-05T10:59:26+10:00 {duration="926", time="2024-04-05T10:59:26.800538+10:00"} {"time":"2024-04-05T10:59:26.800538+10:00","level":"INFO","source":{"function":"main.main","file":"/Users/carlo/grafana/demo-logs/main.go","line":25},"msg":"step","version":1,"duration":926}
2024-04-05T10:59:26+10:00 {duration="613", time="2024-04-05T10:59:26.800482+10:00"} {"time":"2024-04-05T10:59:26.800482+10:00","level":"INFO","source":{"function":"main.main","file":"/Users/carlo/grafana/demo-logs/main.go","line":25},"msg":"step","version":1,"duration":613}
2024-04-05T10:59:26+10:00 {duration="173", time="2024-04-05T10:59:26.800206+10:00"} {"time":"2024-04-05T10:59:26.800206+10:00","level":"INFO","source":{"function":"main.main","file":"/Users/carlo/grafana/demo-logs/main.go","line":25},"msg":"step","version":1,"duration":173}
2024-04-05T10:59:25+10:00 {duration="37", time="2024-04-05T10:59:25.85054+10:00"}   {"time":"2024-04-05T10:59:25.85054+10:00","level":"INFO","source":{"function":"main.main","file":"/Users/carlo/grafana/demo-logs/main.go","line":25},"msg":"step","version":1,"duration":37}
2024-04-05T10:59:25+10:00 {duration="145", time="2024-04-05T10:59:25.850523+10:00"} {"time":"2024-04-05T10:59:25.850523+10:00","level":"INFO","source":{"function":"main.main","file":"/Users/carlo/grafana/demo-logs/main.go","line":25},"msg":"step","version":1,"duration":145}
2024-04-05T10:59:25+10:00 {duration="473", time="2024-04-05T10:59:25.850506+10:00"} {"time":"2024-04-05T10:59:25.850506+10:00","level":"INFO","source":{"function":"main.main","file":"/Users/carlo/grafana/demo-logs/main.go","line":25},"msg":"step","version":1,"duration":473}
2024-04-05T10:59:25+10:00 {duration="452", time="2024-04-05T10:59:25.850491+10:00"} {"time":"2024-04-05T10:59:25.850491+10:00","level":"INFO","source":{"function":"main.main","file":"/Users/carlo/grafana/demo-logs/main.go","line":25},"msg":"step","version":1,"duration":452}
2024-04-05T10:59:25+10:00 {duration="881", time="2024-04-05T10:59:25.850479+10:00"} {"time":"2024-04-05T10:59:25.850479+10:00","level":"INFO","source":{"function":"main.main","file":"/Users/carlo/grafana/demo-logs/main.go","line":25},"msg":"step","version":1,"duration":881}
2024-04-05T10:59:25+10:00 {duration="418", time="2024-04-05T10:59:25.850464+10:00"} {"time":"2024-04-05T10:59:25.850464+10:00","level":"INFO","source":{"function":"main.main","file":"/Users/carlo/grafana/demo-logs/main.go","line":25},"msg":"step","version":1,"duration":418}
2024-04-05T10:59:25+10:00 {duration="860", time="2024-04-05T10:59:25.850449+10:00"} {"time":"2024-04-05T10:59:25.850449+10:00","level":"INFO","source":{"function":"main.main","file":"/Users/carlo/grafana/demo-logs/main.go","line":25},"msg":"step","version":1,"duration":860}
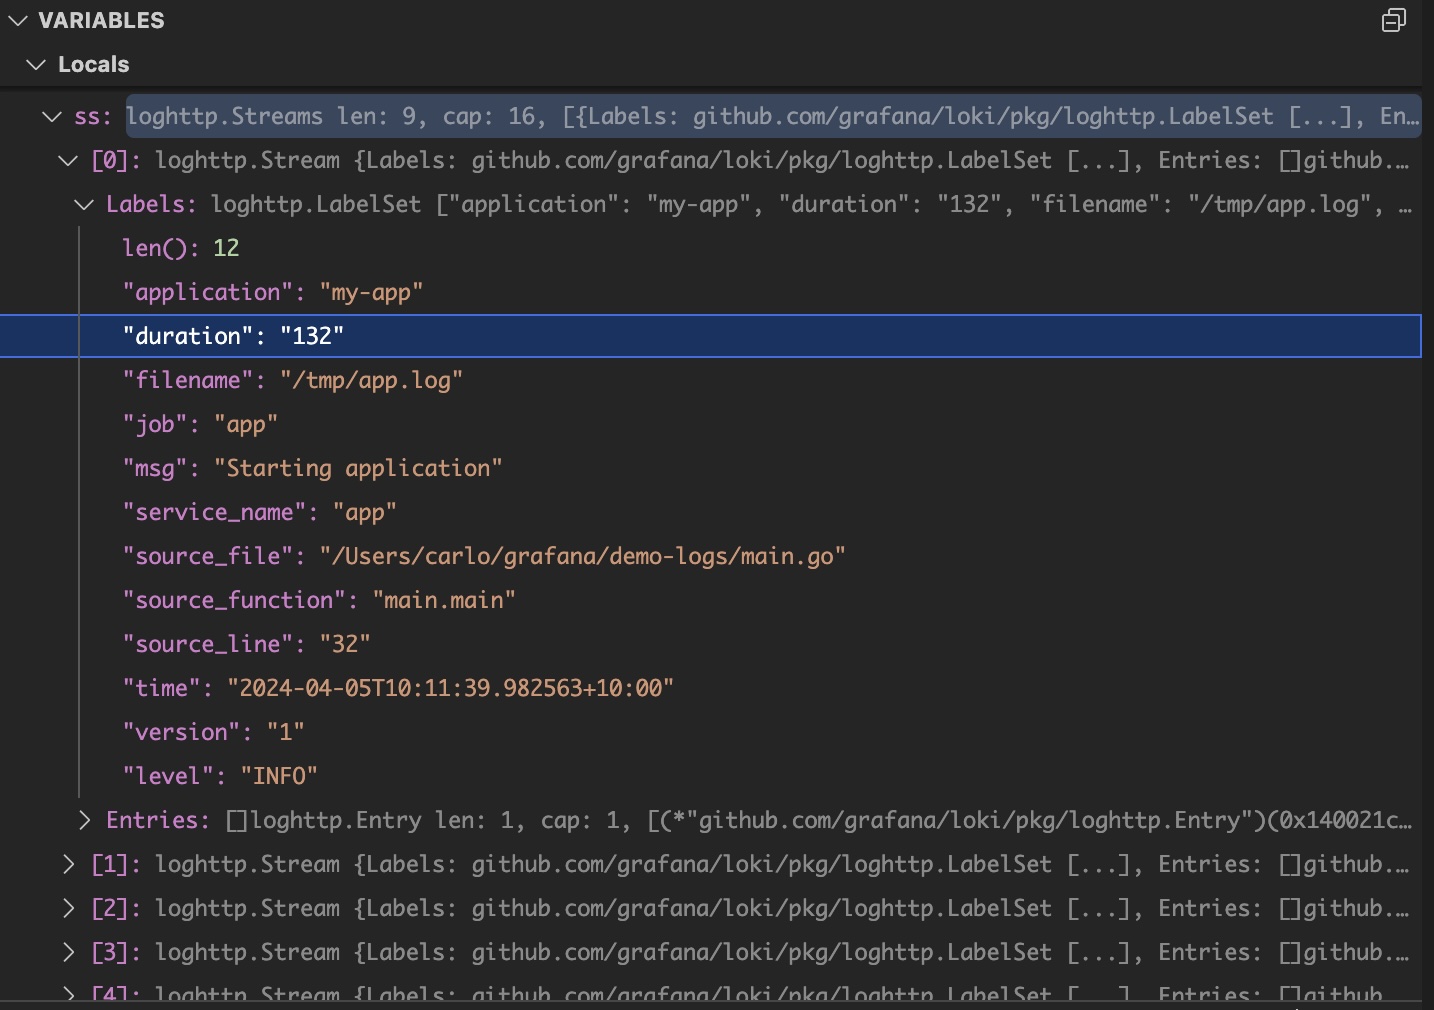
Now we see duration labels:
{duration="860", time="2024-04-05T10:59:25.850449+10:00"}
This surprised me because I wasn’t aware that label values are strings. This seems to be a historical consequence
of Loki building on Prometheus. In
the source for Loki
we see that Stream is a LabelSet, and LabelSet is a map[string]string:
type Stream struct {
	Labels  LabelSet `json:"stream"`
	Entries []Entry  `json:"values"`
}

// LabelSet is a key/value pair mapping of labels
type LabelSet map[string]string
(Not being familiar with the Loki source, I stepped through a query in the VS Code debugger (which uses Delve) which showed the string value for a label.)
Before I realised that labels are strings, I read loki/latest/query/template_functions and got the mistaken impression that I could use a template to cast a value to another type. Along this line I tried
{job="app"} |= `duration`
            | json
            | label_format duration2=`{{ .duration | int }}`
but duration2 is still a string.
Visualise the data Link to heading
Given that labels are strings, we will deal with the type conversion in the next step, visualisation.
If we try to create a heatmap visualisation in Grafana using this query
{job="app"} |= `duration` | json
then Grafana complains “no heatmap fields found”:
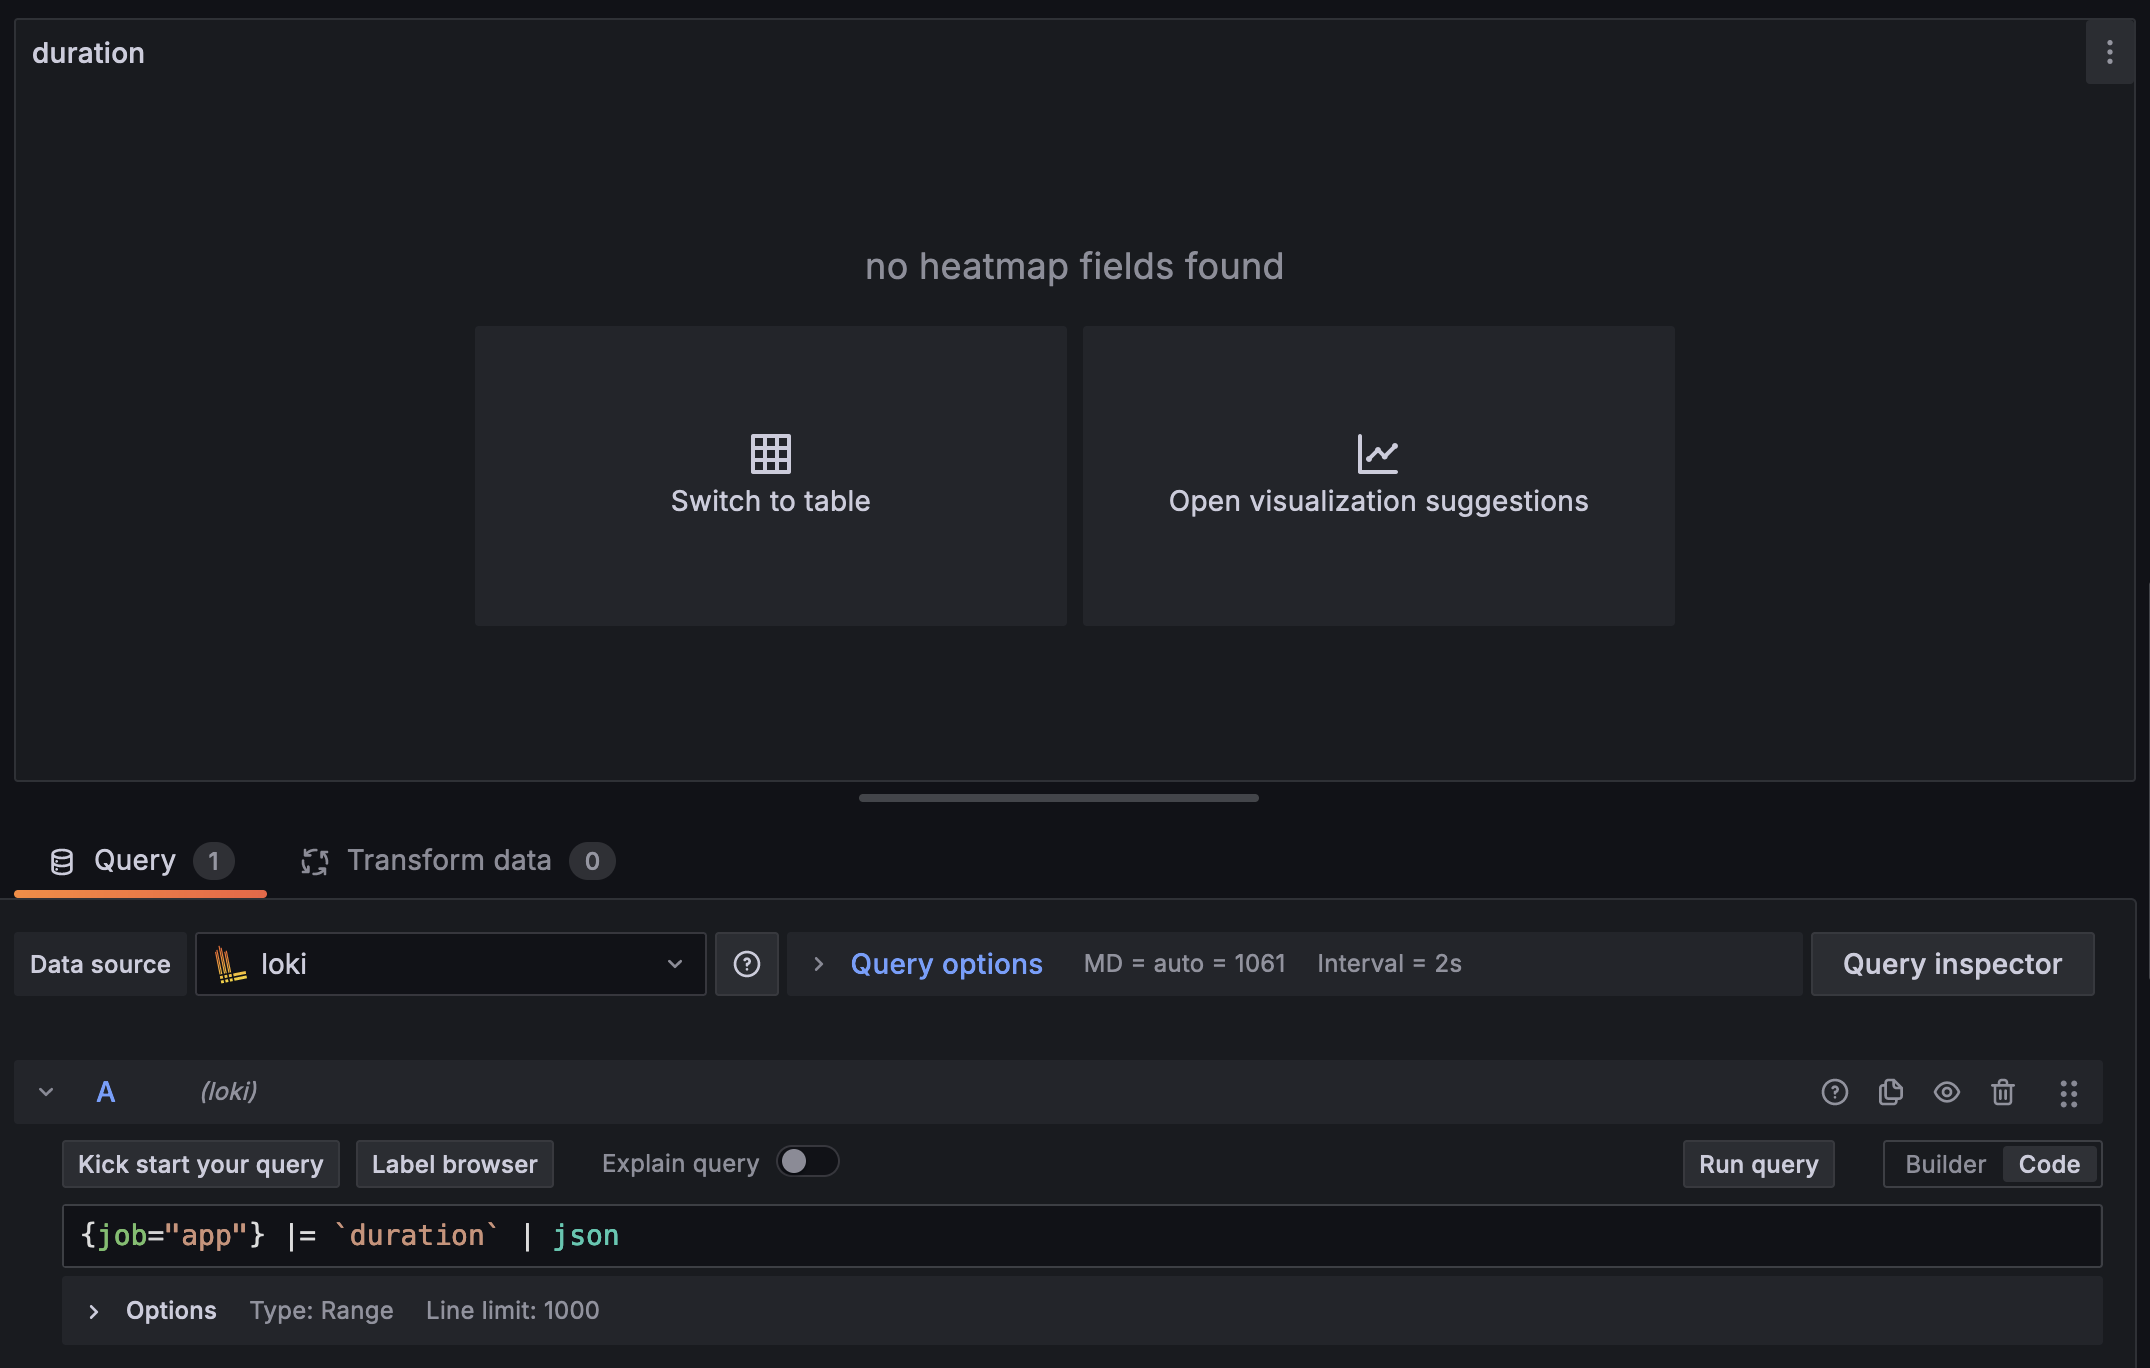
The solution is to add two transformations (post-processing steps):
first extract the labels, and then convert duration to a number:
Now we can plot a heatmap:
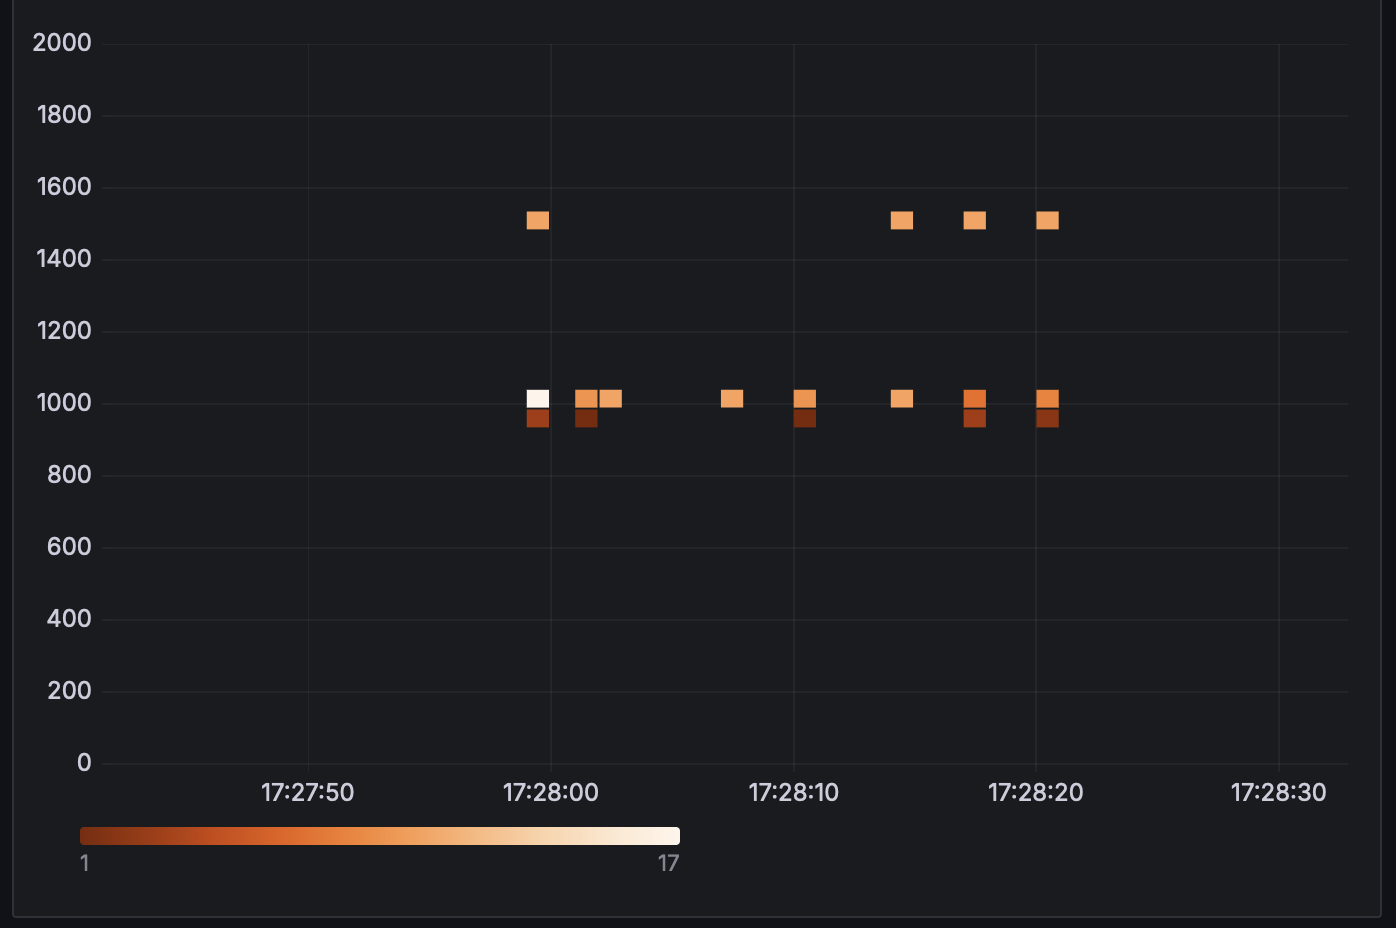
Heatmaps are so easy to read. At a glance we can say:
- Periodically there is a burst of 10 or so requests that result in 1500ms response times.
- Typical responses are around 1000ms. There was a bucket of 17 (white cell) show this is the most frequent response time.
- It is rare for a request to be processed in under 1000ms. When it happens there is only a single request (dark cells corresponding to single values).
Beware that the Loki query has an implicit line limit - here I set it to the maximum 5000:

At scale, with tens of thousands of requests in the viewing range, the heatmap would not be truly representative of the data because some log entries would be dropped. In the next section we will see an alternative query type that avoids this issue.
Metric queries Link to heading
The query in the previous section sends the raw data to Grafana for construction of the heatmap. In contrast, metric queries are aggregated by Loki. In this way we avoid the potential line limit issue.
We care about worst case.
behaviour, so let’s use the max_over_time query over duration:
max_over_time({job="app"} |= `duration`
                          | json
                          | unwrap duration [$__auto])
This is simpler to use in Grafana as well - we don’t have to set up the two transformations to extract duration as a number.
Quirks of heatmaps with custom ranges Link to heading
The default in Grafana is to use a custom step size (the [$__auto] parameter in the query). I recommend keeping this default.
When we set the step size to a fixed value like 1m (one minute) and zoom in too far,
LogQL/Grafana will oversample values: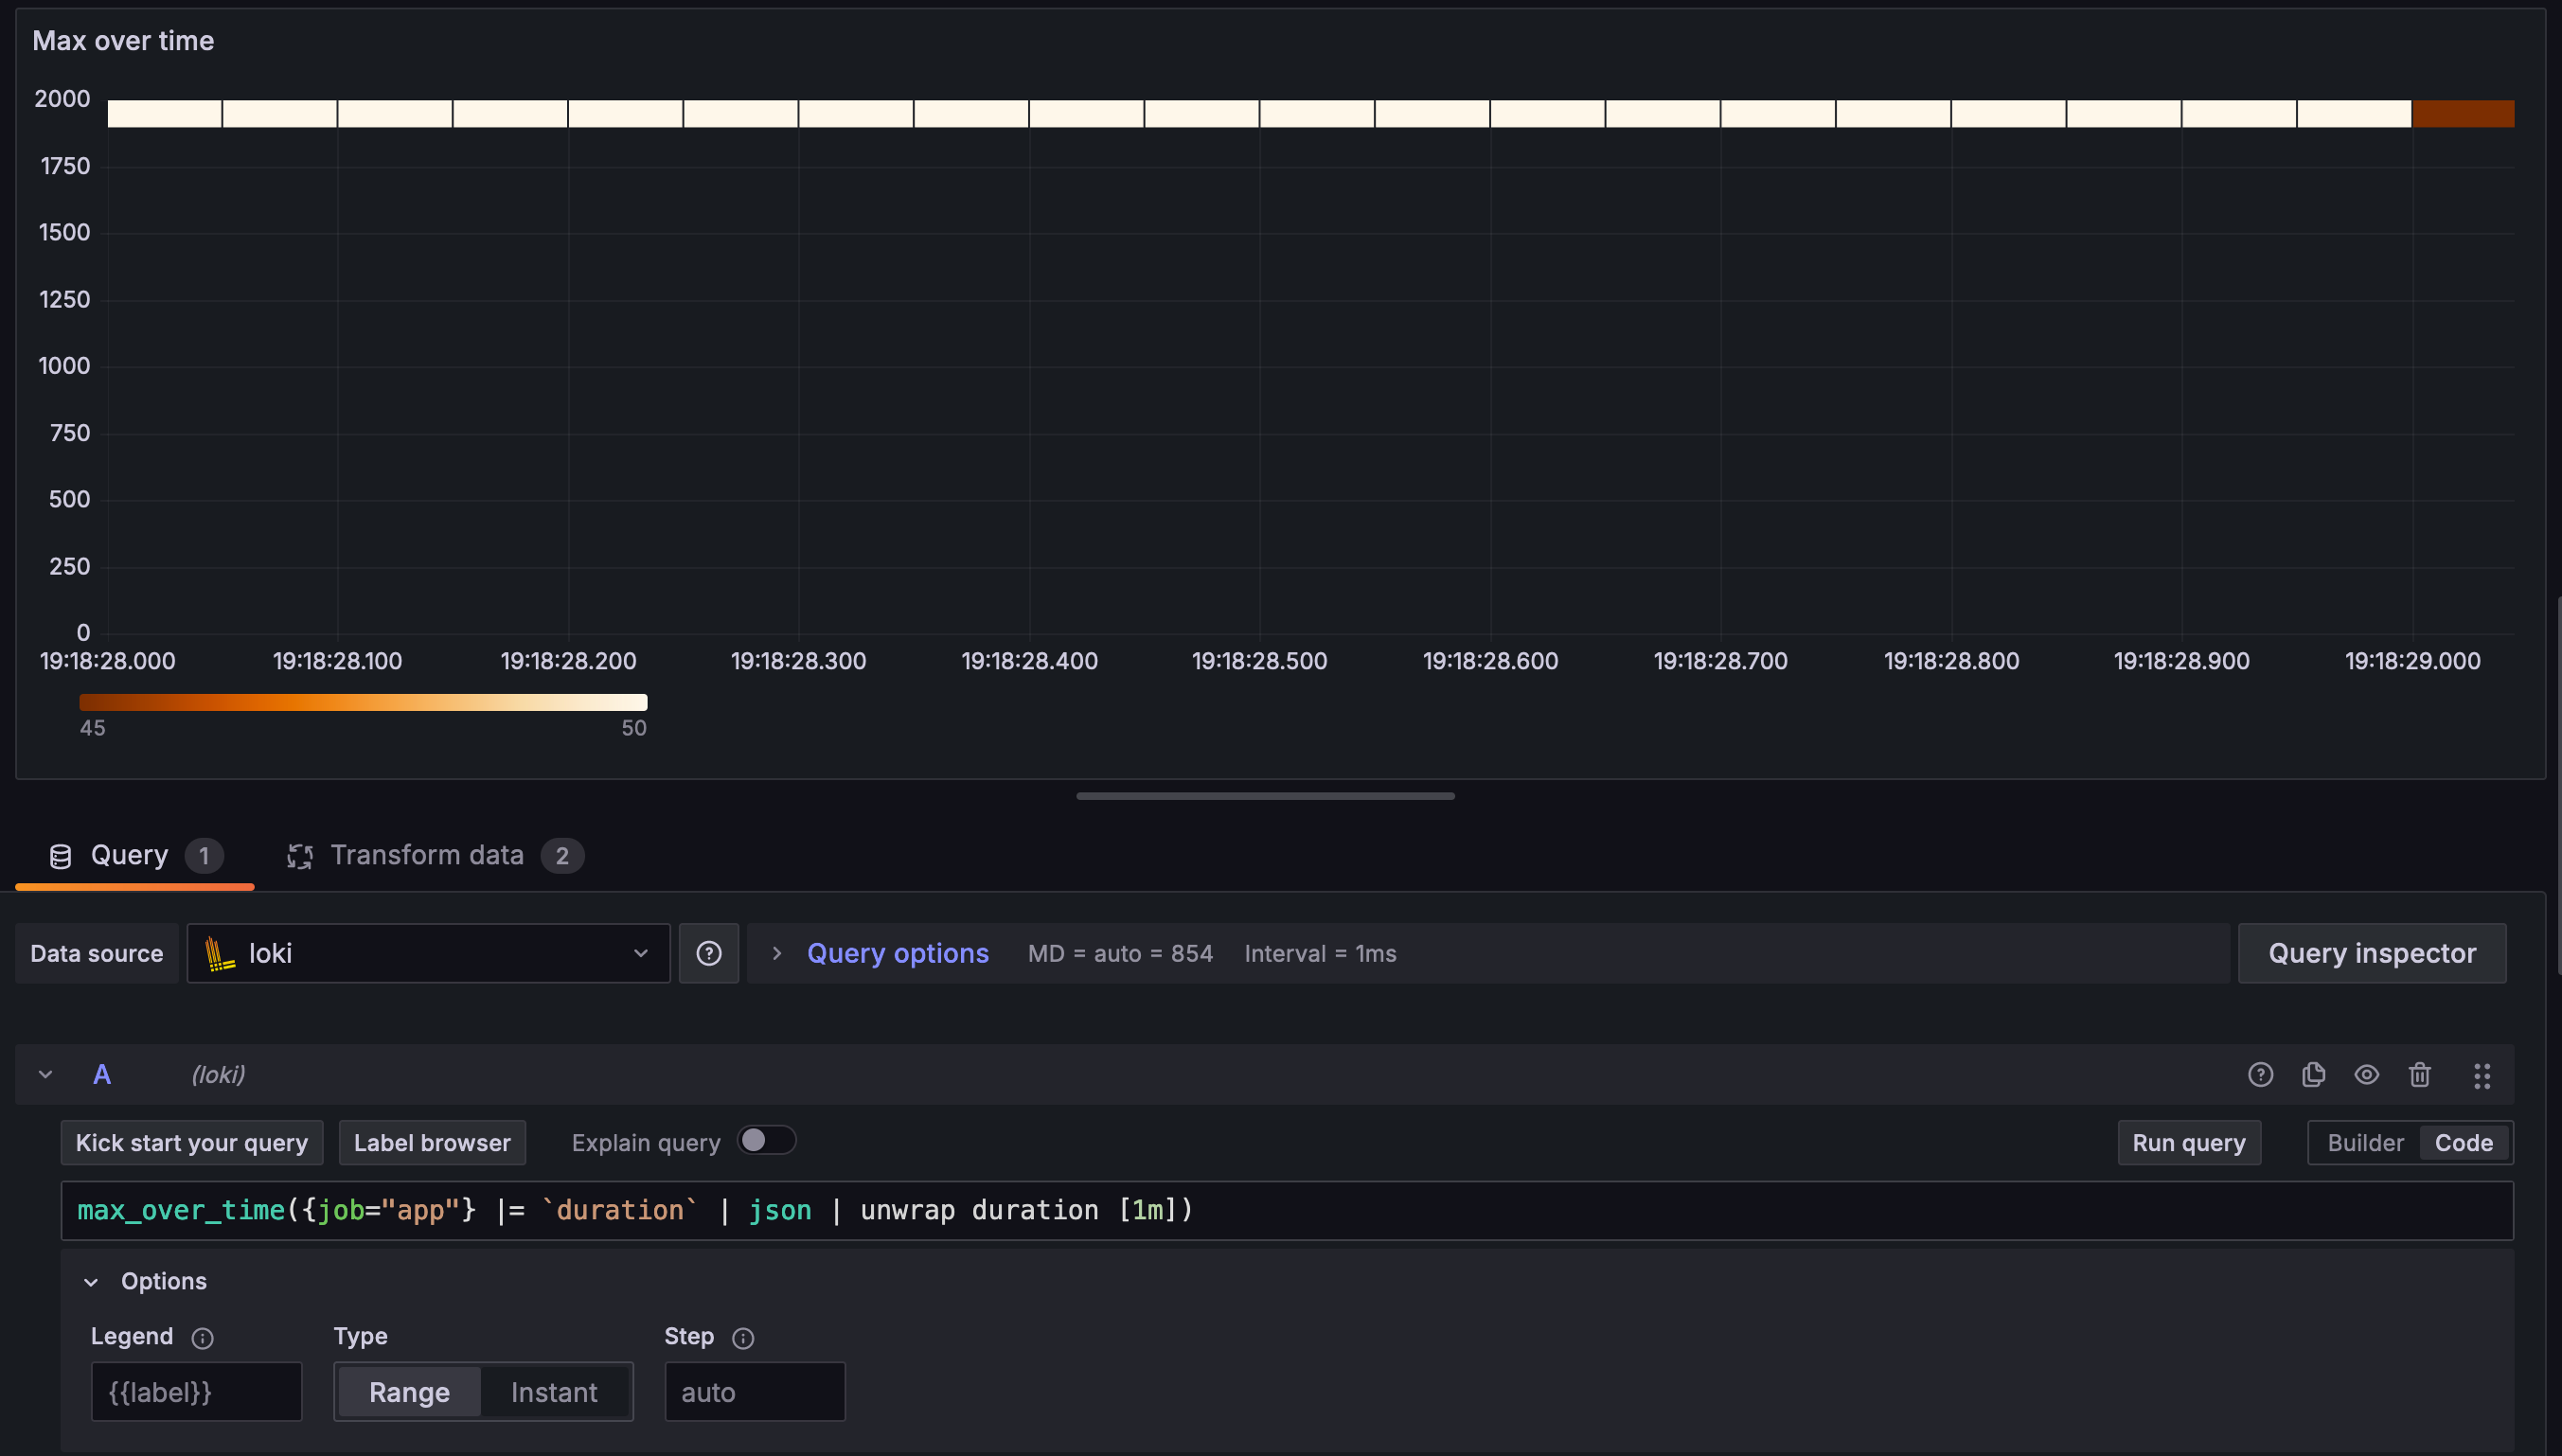
Grafana drew 20 squares representing the count 50, and one for count 45; This total 1045 corresponds to the number of times that 1899 is sampled. But in this contrived example there is only a single log entry with duration = 1899:
{"time":"2024-04-06T18:36:57.80441+10:00","duration":933,"level":"INFO","source":{"function":"main.main","file":"/Users/carlo/grafana/demo-logs/main.go","line":26},"msg":"step","version":1}
{"time":"2024-04-06T18:47:44.567945+10:00","duration":1042,"level":"INFO","source":{"function":"main.main","file":"/Users/carlo/grafana/demo-logs/main.go","line":26},"msg":"step","version":1}
{"time":"2024-04-06T19:05:14.911419+10:00","duration":1501,"level":"INFO","source":{"function":"main.main","file":"/Users/carlo/grafana/demo-logs/main.go","line":26},"msg":"step","version":1}
{"time":"2024-04-06T19:16:23.747189+10:00","duration":1522,"level":"INFO","source":{"function":"main.main","file":"/Users/carlo/grafana/demo-logs/main.go","line":26},"msg":"step","version":1}
{"time":"2024-04-06T19:17:56.945765+10:00","duration":1899,"level":"INFO","source":{"function":"main.main","file":"/Users/carlo/grafana/demo-logs/main.go","line":26},"msg":"step","version":1}
I was curious so I stepped through the query in VS Code and added a fmt.Printf
in engine.go:
series := make([]promql.Series, 0, len(seriesIndex))
	for _, s := range seriesIndex {
		series = append(series, *s)
		fmt.Printf("appending series: %v\n", *s) // debugging
	}
	result := promql.Matrix(series)
	sort.Sort(result)

	return result, stepEvaluator.Error()
Now we see the oversampling:
appending series: {filename="/tmp/app.log", job="app", level="INFO", msg="step", service_name="app", source_file="/Users/carlo/grafana/demo-logs/main.go", source_function="main.main", source_line="26", time="2024-04-06T19:17:56.945765+10:00", version="1"} =>
1899 @[1712395108000]
1899 @[1712395108001]
1899 @[1712395108002]
1899 @[1712395108003]
1899 @[1712395108004]
1899 @[1712395108005]
1899 @[1712395108006]
1899 @[1712395108007]
1899 @[1712395108008]
1899 @[1712395108009]
1899 @[1712395108010]
1899 @[1712395108011]
1899 @[1712395108012]
1899 @[1712395108013]
1899 @[1712395108014]
1899 @[1712395108015]
(Total 1045 lines of this)
My understanding is that the “step size” is too small relative to the total time period so the sliding window samples the single value 1899 too many times.
Further reading Link to heading
Loki builds on Prometheus as one can see from the code snippet above: the series are promql.Series. This blog post explains how
the range aggregations work with sliding windows: https://iximiuz.com/en/posts/prometheus-functions-agg-over-time/
How to undersample: https://www.robustperception.io/step-and-query_range/
An old Github issue about step, resolution, interval, etc: Loki: step/resolution/interval/min_interval is confusing #52387
An old Github issue about interval not scaling with resolution: $__interval doesn’t scale with Loki query resolution value #52290
A talk about “misery metrics” from p99conf:
Acknowledgements Link to heading
I acknowledge feedback on an earlier draft from https://nadiah.org and https://claude.ai.
Comment form pending Cloudflare verification...
Loading comments…